< cd ~/raba.pl

Developer & personal tools

Claude Limits Monitor

Move a useful piece of information out of a settings page and into the working day.

  • Prototype
  • February 2026
  • Solo: design, code

The problem

A small utility should stay useful when one component is unavailable. It also should not require a complex service just to display the latest usage snapshot.

My part

A personal developer utility I designed and built. It is presented as an MVP, without an adoption claim.

What this shows

I can turn a recurring annoyance into a focused tool and make the integration resilient without making it elaborate.

Where it started

Claude's session and weekly usage limits are normally checked on a settings page. This tool makes that same information available in a Chrome badge, popup and macOS menu bar.
See it in action

Product walkthrough · 0:36 · 60 FPS · English narration
Claude Limits Monitor interface

English AI narration · Subtitles included · Play with sound, or read the transcript.

Read the video transcript

0:00 I built a small tool that keeps Claude usage limits visible while I work.

0:08 A menu bar plugin refreshes the latest information from a local bridge.

0:16 The browser extension captures usage, and the bridge makes it available on the desktop.

0:23 Updates stay in a local history, so changes can be inspected later.

The decisions behind the product

Capture the information where it is available

The extension reads API responses, rate-limit headers and usage-page text, then presents the highest usage share on its badge.

Connect the browser and desktop

A local Node bridge stores the latest snapshot. A Python plugin reads it into SwiftBar or xbar with percentages and reset times.

Keep failure small

The extension continues without the bridge, and the menu bar can use the last stored file. The bridge and plugin use built-in libraries rather than package-registry dependencies.

What came out of the work

A glanceable working tool

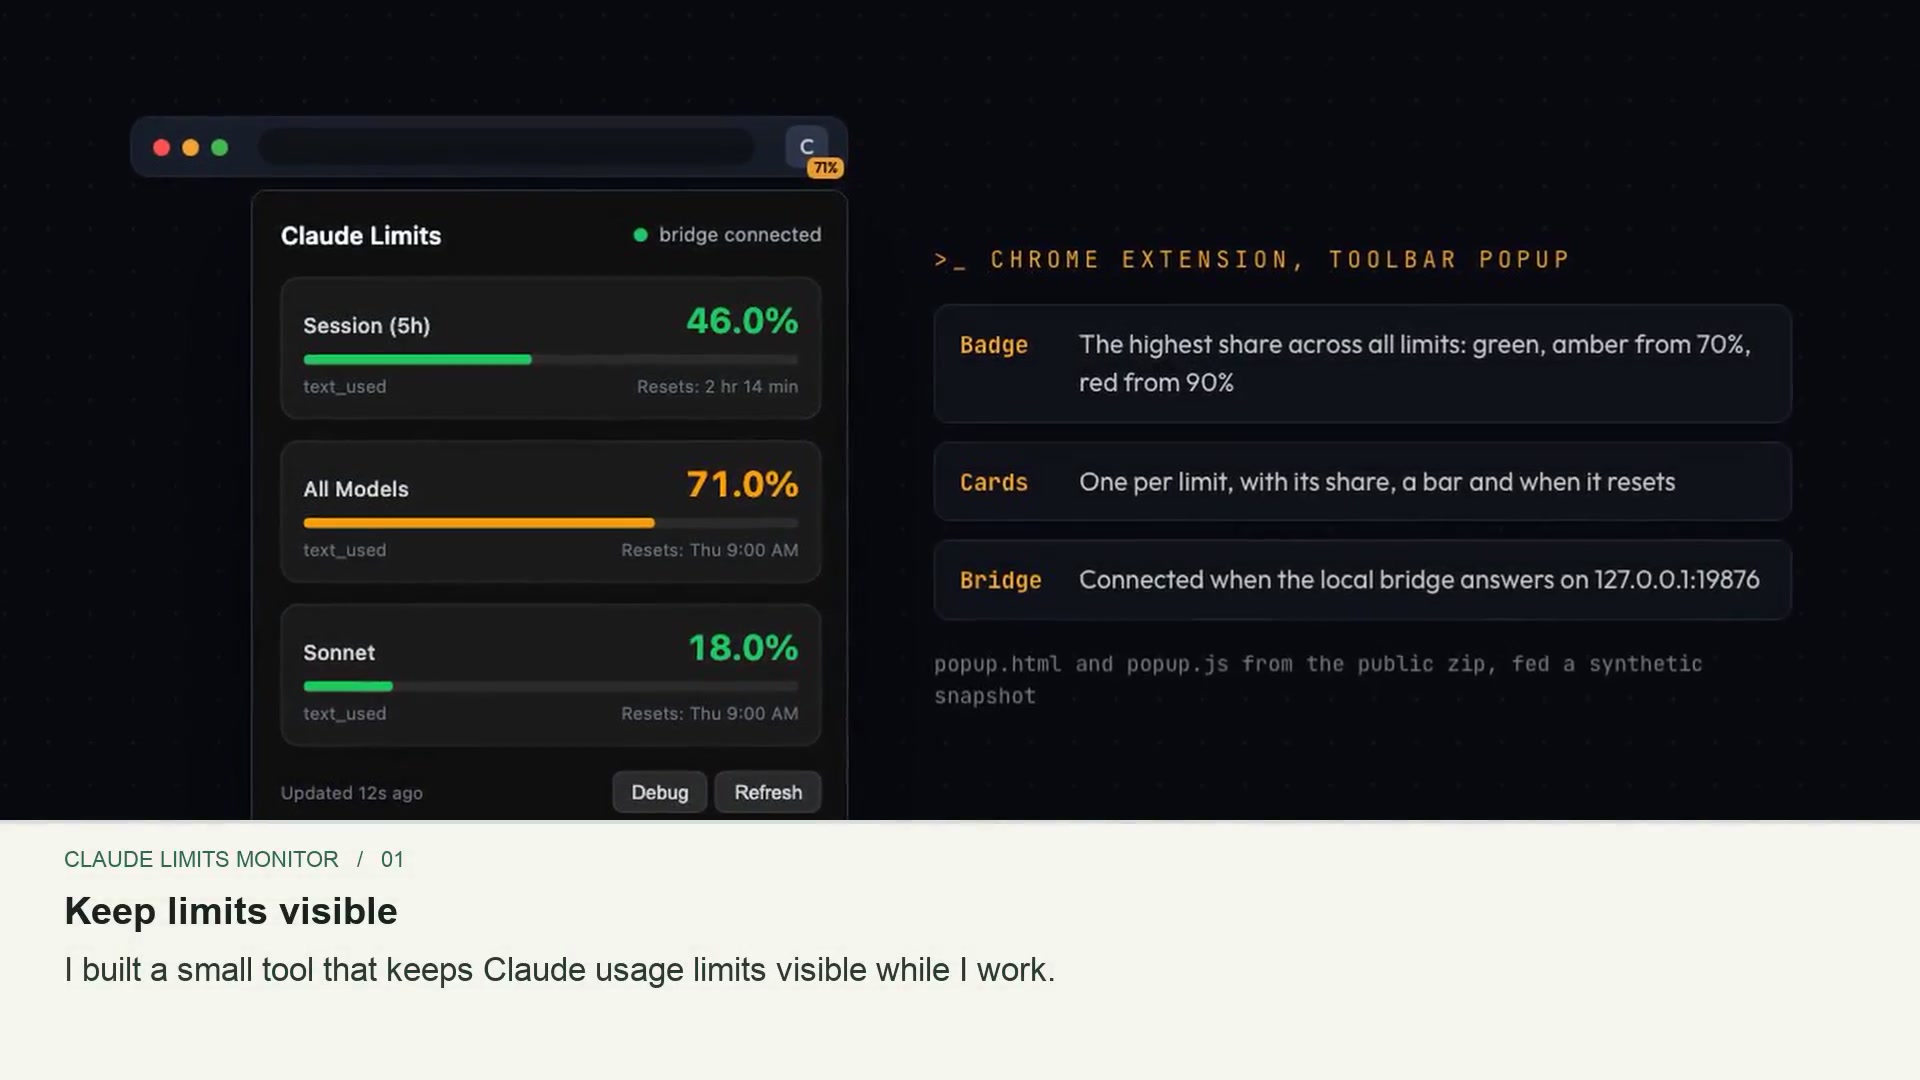
Usage and reset times are available on the browser toolbar and in the macOS menu bar, with a detailed popup when needed.

A lightweight local setup

The bridge runs on the local machine and starts at login. Components show a clear offline or empty state when fresh information is unavailable.

  • 2places to see usage: browser and menu barMVP · checked 6 Oct 2026
  • Localbridge keeps a snapshot and usage historyMVP · checked 6 Oct 2026

Documentation interest

Google Search Console

Google search clicks

Exact documentation page: https://raba.pl/resources/claude-limits-monitor

Latest month
11 Sept - 30 Sept 2026
First month
01 Apr - 30 Apr 2026

Search interest in the documentation page. It does not measure installs or active tool users.

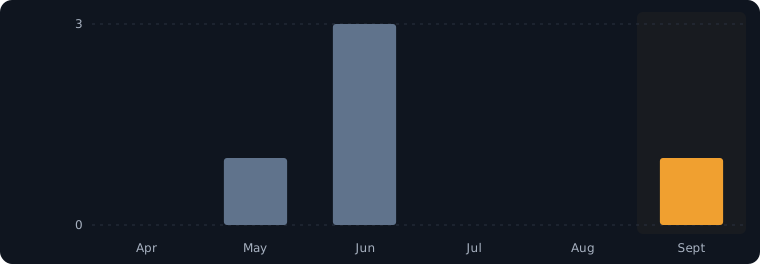
Google search clicks per month, 1 Apr to 30 Sept 2026Google Search Console. Exact documentation page: https://raba.pl/resources/claude-limits-monitor. Monthly clicks. 1 Apr: 0; 1 May: 1; 1 Jun: 3; 1 Jul: 0; 1 Aug: 0; 1 Sept: 1. Vertical axis starts at zero.031 Apr - 30 Apr 2026: 0 clicks1 May - 31 May 2026: 1 clicks1 Jun - 30 Jun 2026: 3 clicks1 Jul - 31 Jul 2026: 0 clicks1 Aug - 31 Aug 2026: 0 clicks1 Sept - 30 Sept 2026: 1 clicksAprMayJunJulAugSept
6 complete months · 1 Apr - 30 Sept 2026 · Download chartFirst month Latest month
Source, methodology and monthly data

Open Google Search Console report · Checked 8 Oct 2026

Exact documentation page: https://raba.pl/resources/claude-limits-monitor. Provider timezone: America/Los_Angeles.

  • Six complete calendar months: 1 April to 30 September 2026. Current is September; comparison baseline is April. Both comparison months have 30 days. This is not a comparison against the preceding six months.
  • Final web-search data, all countries and devices, America/Los_Angeles reporting timezone. Search clicks are not website visits or unique visitors.
  • Domain properties include all subdomains with property aggregation. Documentation pages retain exact page filters from the preceding evidence collection and measure documentation interest, not adoption.
  • Monthly chart values and the six-month total are reconciled with independently queried totals.
  • The percentage, where shown, compares September 2026 with April 2026, the last and first complete months of this window.
  • April has fewer than 100 events, so absolute counts are shown without a percentage growth claim.
  • For fewer than 100 events in the baseline period, the comparison shows absolute counts instead of a percentage.
Complete monthly totals
MonthGoogle search clicks
1 Apr - 30 Apr 20260
1 May - 31 May 20261
1 Jun - 30 Jun 20263
1 Jul - 31 Jul 20260
1 Aug - 31 Aug 20260
1 Sept - 30 Sept 20261
PostHog recorded activity1 pageviews in 28 days

Exact documentation page: https://raba.pl/resources/claude-limits-monitor · UTC

Recorded activity is affected by consent, blockers, tracking gaps and internal traffic.

Recorded totals, separate from search data
Metric7 Sept - 4 Oct 202610 Aug - 6 Sept 2026
Recorded pageviews11
Recorded sessions11

Inside the implementation

Explore the features, architecture and quality checks

What I built

  • A Chrome extension (Manifest V3) that reads usage on claude.ai three ways: API responses and rate-limit headers caught by a fetch and XHR interceptor, and the usage page text read by a content script
  • A toolbar badge with the highest share across all limits: green, amber from 70% and red from 90%
  • A popup with one card per limit, showing its share, a progress bar and the reset time, and whether the local bridge is connected
  • A Node.js bridge on 127.0.0.1:19876 that keeps the latest snapshot in ~/.claude-limits/usage.json and appends every update to history.jsonl
  • A SwiftBar and xbar plugin in Python that puts two limits in the macOS menu bar and lists every limit with a 10-step bar and its reset time
  • An install script that registers the bridge as a macOS LaunchAgent, so it starts at login

How it works

  1. CaptureOn claude.ai, an interceptor reads API responses and rate-limit headers; a content script reads the usage page.
  2. StoreThe background worker merges the numbers, keeps them in extension storage and updates the badge.
  3. SyncSent to the local bridge as POST /update on every change and once a minute.
  4. KeepThe bridge writes usage.json and appends a line to history.jsonl.
  5. ShowThe menu bar plugin reads /status every 5 minutes, or the file when the bridge is down.

Quality and reliability

  • The extension works without the bridge: a failed sync is skipped, and the popup marks the bridge as offline
  • The menu bar plugin falls back from the bridge to usage.json, and shows a short "No usage data yet" menu when neither has numbers
  • Nothing to install from a package registry: the bridge uses only Node's built-in modules and the plugin only Python's standard library

Technology

  • Chrome extension, Manifest V3 (JavaScript)
  • Node.js http server
  • Python SwiftBar/xbar plugin
  • macOS LaunchAgent
  • JSON and JSON Lines files

Explore another problem I worked on

>_ Your next project

Liked what you saw?
Let’s get in touch!

Have an idea, a challenge, or a role in mind? I’d love to hear about it.

Let’s talk

>_ Start a conversation

Liked what you saw?
Let’s get in touch!

Tell me what you’re working on. Let’s see how I can help.

Email mepatryk@raba.pl
Send a message