Connect the different views of the signal
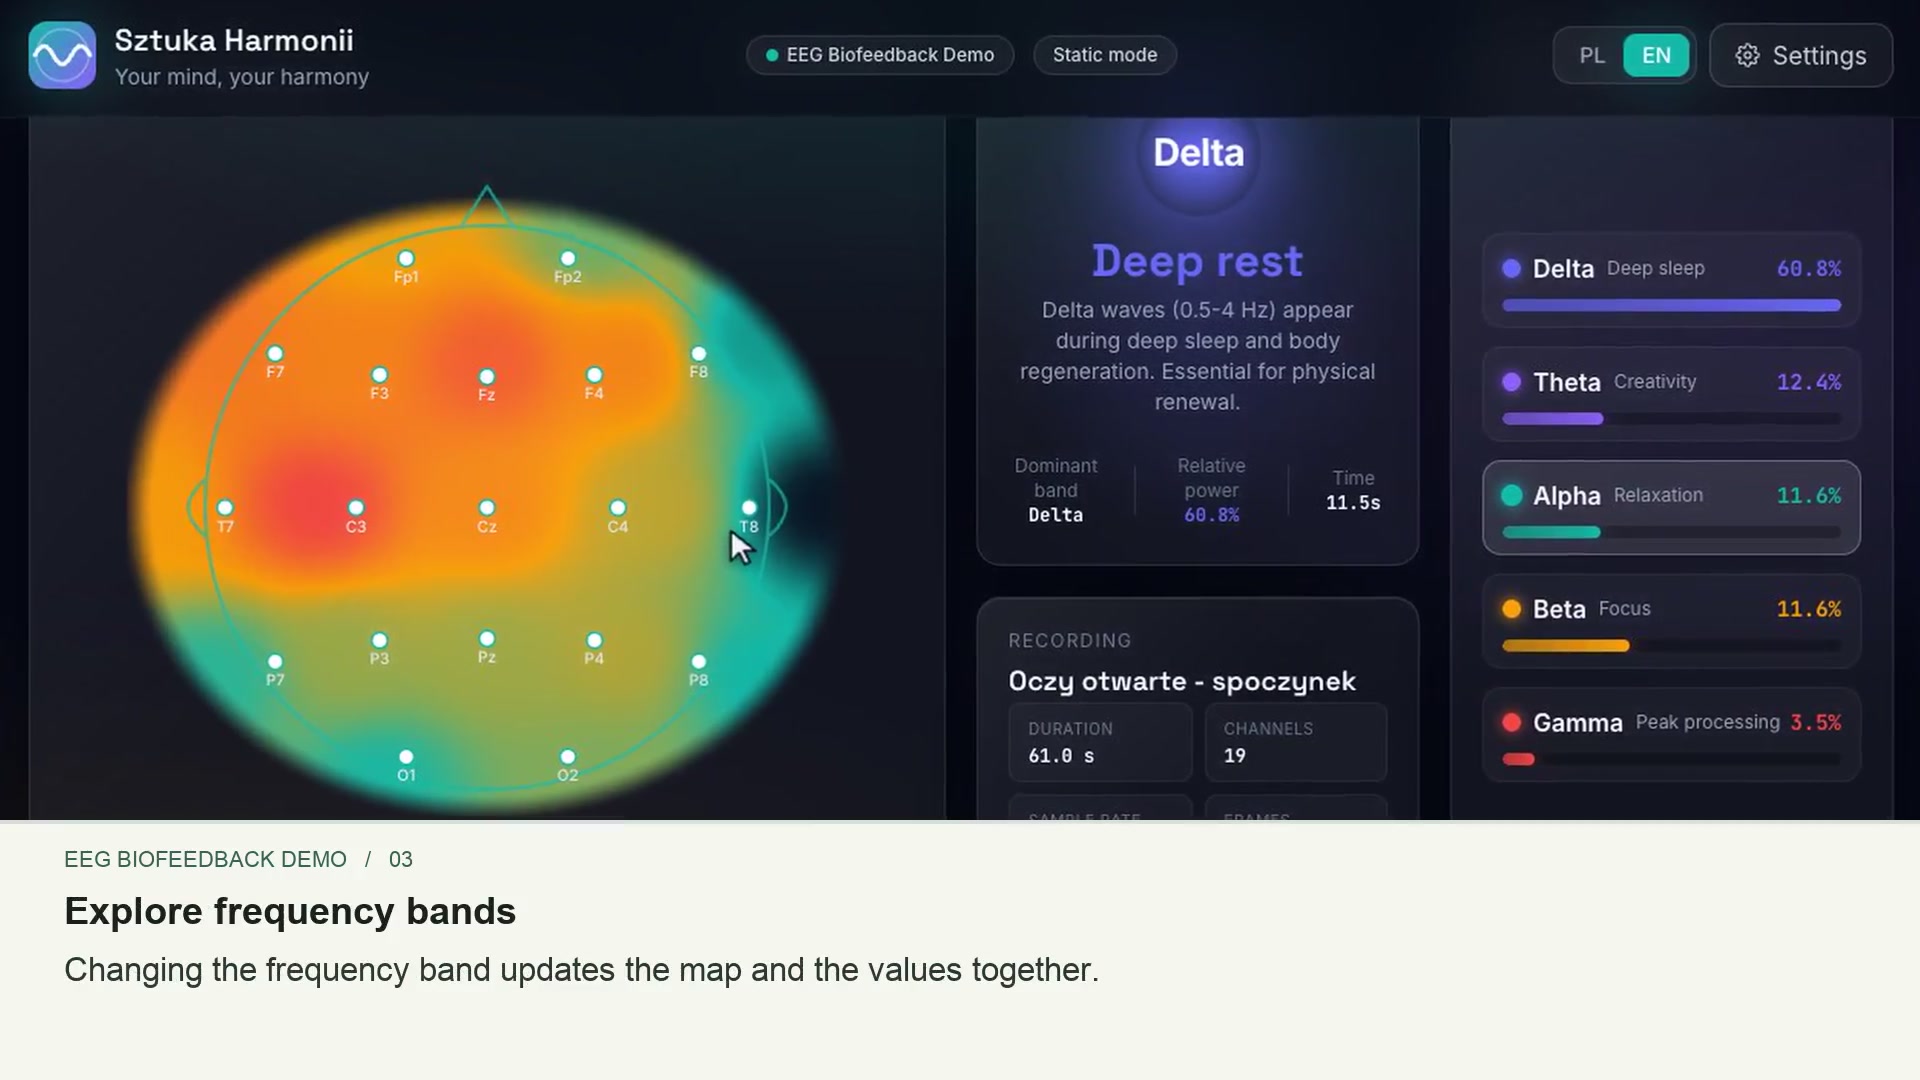
I built a scalp map, band-share display, 19-channel signal preview and timeline. Moving through a recording keeps those views focused on the same moment.
Make an abstract signal visible enough to explain, without requiring a headset or uploading a recording.
The interface needed to connect the raw signal, electrode positions and frequency bands into one understandable view. Processing a local recording also had to work without sending the file to a server.
Built for Sztuka Harmonii, which owns the code. Public recordings and local files power the demo.
I can translate a specialized domain into an interactive explanation and build the data processing needed to support it.
I built this browser demo for Sztuka Harmonii. It uses public PhysioNet recordings to illustrate changes in EEG activity, and can open a visitor's own EDF files locally.
English AI narration · Subtitles included · Play with sound, or read the transcript.
0:00 I built this interactive brain-signal demo for Sztuka Harmonii, using a public research recording.
0:08 The scalp map turns nineteen electrode signals into an animated view of band power.
0:15 Changing the frequency band updates the map and the values together.
0:22 Different montage presets show what changes when fewer electrodes are available.
0:35 The signal view keeps the original channels visible alongside the visual summary.
0:41 A shared timeline makes changes across recordings easier to compare.
0:50 In these recordings, the share of alpha activity is higher with eyes closed than with eyes open.
1:00 People can load their own recording. File processing stays inside the browser.
1:07 The preprocessing settings are documented, so the visualisation can be traced back to the signal pipeline.
1:23 It is a focused demonstration of making technical information explorable and understandable.
I built a scalp map, band-share display, 19-channel signal preview and timeline. Moving through a recording keeps those views focused on the same moment.
A Web Worker parses EDF files and computes band power. Local files stay on the device, with storage in IndexedDB and a browser-generated PDF report.
Bundled public recordings are preprocessed with MNE-Python. The interface supports Polish and English and can run from static data without the optional server.
The demo connects 19 electrode positions with signals, frequency bands and an interactive timeline, using two public eyes-open and eyes-closed recordings.
Supported EDF files can be opened and processed without uploading them. The product replays recordings; it is not a live headset integration or evidence of a clinical result.